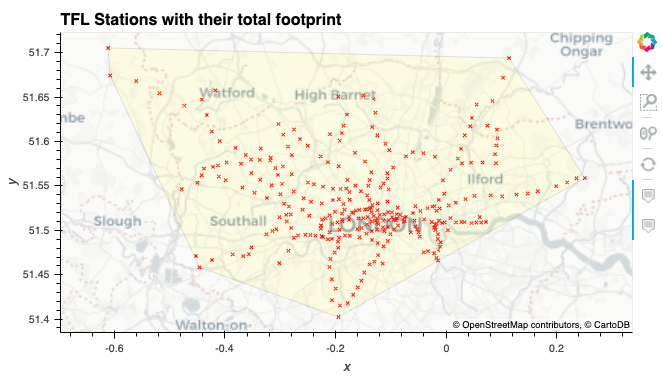
I’ve added to the python workshops repo with a guide on the basics of Geospatial Analytics.
We’ll be going through:
- Data gathering and manipulation with
geopandas - Interactive visualisation with
hvplot - Rapid nearest neighbour calculation with
kdtrees - Calculating voronoi regions with
scipy.spatial - Spatial joins
To do this we’ll be exploring TFL station data and generating 1000 random points in London to work with.
There’s also a couple of challenges at the end! To see the repo, click here.
To see and run the code in an executable environment, click below.
To quickly view the code in read-only mode, click here.

P.S On a technical note, I’ve switched from using Jupyter Notebook to JupyterLab for these workshops, the dark theme is a lot easier on the eyes!
P.P.S Got something you’d like me to write a post about? Feel free to raise a GitHub issue on the python-workshops repo and I’ll see what I can do.