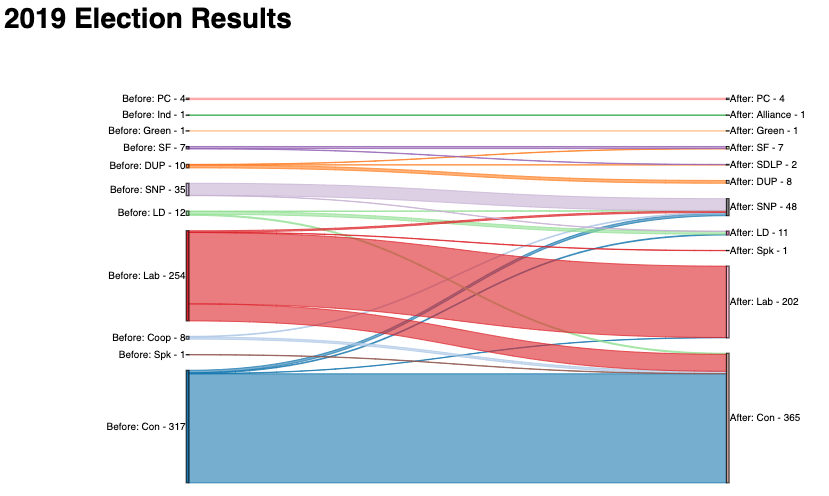
Today we’ll be looking at Sankey Diagrams, which are a great way of visualising changes in state between groups. We’ll look at seats gained and lost in the 2019 UK General Election. The data doesn’t come in the correct form, so we’ll be doing some string manipulation in pandas to manipulate it.
To see the repo, click here.
To see and run the code in an executable environment, click below.
To quickly view the code in read-only mode, click here.